Basics of Dynamic PET
This notebook illustrates basic image input/output functionality of Dynamic PET.
First, we download a 4-D PET image with its PET-BIDS json sidecar from OpenNeuro:
from pathlib import Path

import requests


outdir = Path.cwd() / "nb_data"
outdir.mkdir(exist_ok=True)

petjson_fname = outdir / "pet.json"
pet_fname = outdir / "pet.nii"

baseurl = "https://s3.amazonaws.com/openneuro.org/ds001705/sub-000101/ses-baseline/"

peturl = (
    baseurl
    + "pet/sub-000101_ses-baseline_pet.nii"
    + "?versionId=rMjWUWxAIYI46DmOQjulNQLTDUAThT5o"
)

if not petjson_fname.exists():
    r = requests.get(
        baseurl
        + "pet/sub-000101_ses-baseline_pet.json"
        + "?versionId=Gfkc8Y71JexOLZq40ZN4BTln_4VObTJR",
        timeout=10,
    )
    r.raise_for_status()
    with open(petjson_fname, "wb") as f:
        f.write(r.content)

if not pet_fname.exists():
    with requests.get(peturl, timeout=10, stream=True) as r:
        r.raise_for_status()
        with open(pet_fname, "wb") as f:
            for chunk in r.iter_content(chunk_size=8192):
                f.write(chunk)
Load 4-D PET image
We read in this 4-D PET image (and its accompanying json) using the load
function from dynamicpet.petbids.petbidsimage:
from dynamicpet.petbids.petbidsimage import load


pet = load(pet_fname)
Basic attributes/properties
The variable pet is an instance of Dynamic PET’s PETBIDSImage class.
This object stores image data in an attribute called img (i.e., pet.img),
which is an instance of a subclass of nibabel.spatialimages.SpatialImage.
(In this example, it happens to be an nibabel.nifti1.Nifti1Image.)
We can get the dimensions of the 4-D image (3-D image dimensions and number of
time frames) using the shape property:
pet.shape
(182, 218, 182, 23)
The variable pet also stores the PET-BIDS json as a dictionary, in an
attribute called json_dict:
pet.json_dict
{'Manufacturer': 'Siemens',
 'ManufacturersModelName': 'Biograph mMr',
 'Units': 'kBq/mL',
 'TracerName': 'LondonPride',
 'TracerRadionuclide': 'C11',
 'BodyPart': 'brain',
 'InjectedRadioactivity': 400.0,
 'InjectedRadioactivityUnits': 'MBq',
 'InjectedMass': 5.0,
 'InjectedMassUnits': 'ug',
 'SpecificRadioactivity': 35.0,
 'SpecificRadioactivityUnits': 'GBq/ug',
 'ModeOfAdministration': 'bolus',
 'TimeZero': '09:45:00',
 'ScanStart': 0,
 'InjectionStart': 0,
 'FrameTimesStart': [0,
  15,
  30,
  45,
  60,
  120,
  180,
  240,
  300,
  450,
  600,
  900,
  1200,
  1500,
  1800,
  2100,
  2400,
  2700,
  3000,
  3300,
  3600,
  4200,
  4800],
 'FrameDuration': [15,
  15,
  15,
  15,
  60,
  60,
  60,
  60,
  150,
  150,
  300,
  300,
  300,
  300,
  300,
  300,
  300,
  300,
  300,
  300,
  600,
  600,
  600],
 'InjectionEnd': 30,
 'AcquisitionMode': '3D',
 'ImageDecayCorrected': True,
 'ImageDecayCorrectionTime': 0,
 'ReconMethodName': 'MLEM',
 'ReconMethodParameterLabels': ['iterations'],
 'ReconMethodParameterUnits': ['none'],
 'ReconMethodParameterValues': [100],
 'ReconFilterType': 'PSF',
 'ReconFilterSize': 2.5,
 'AttenuationCorrection': 'Activity decay corrected'}
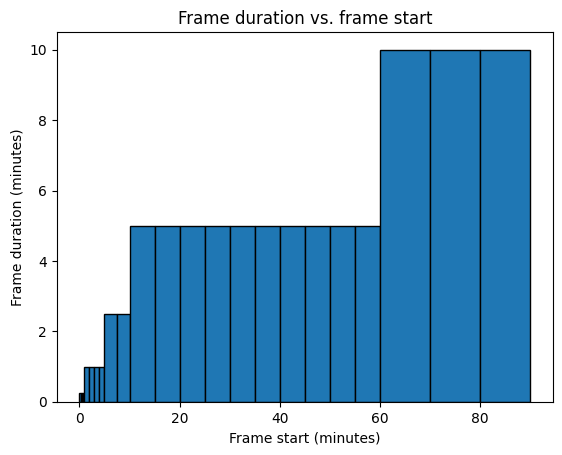
Frame timing information
Dynamic PET includes properties/functions such as
frame_start, frame_end, frame_mid, frame_duration
to extract frame timing information.
:exclamation: Note: the default unit in PET-BIDS json files is seconds. Dynamic PET converts these to minutes, so all of the timing functions in Dynamic PET return values in minutes.
Dynamic PET internally performs certain data checks, so using these properties/functions are preferred over directly extracting the values from the json files.
import matplotlib.pyplot as plt


plt.figure()
plt.bar(
    pet.frame_start,
    pet.frame_duration,
    width=pet.frame_duration,
    edgecolor="black",
    align="edge",
)
plt.xlabel("Frame start (minutes)")
plt.ylabel("Frame duration (minutes)")
plt.title("Frame duration vs. frame start");
Matplotlib is building the font cache; this may take a moment.

Basic visualization
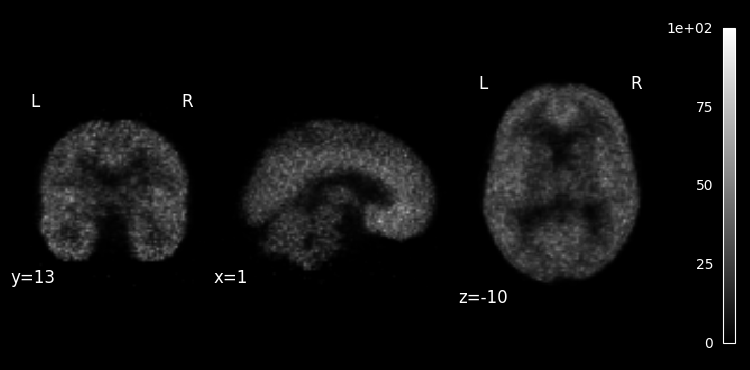
We find and plot the first 5-minute long frame using nilearn:
from nilearn import plotting
from nilearn.image import index_img


frame_index = (pet.frame_duration == 5).argmax()
plotting.plot_anat(index_img(pet.img, frame_index), colorbar=True, draw_cross=False);

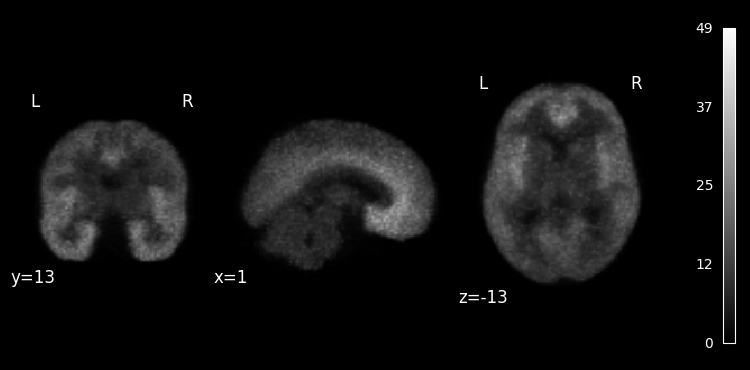
We can also plot a weighted mean of all time frames, where each frame is weighted according to its duration:
plotting.plot_anat(
    pet.dynamic_mean(weight_by="frame_duration"),
    colorbar=True,
    draw_cross=False,
);

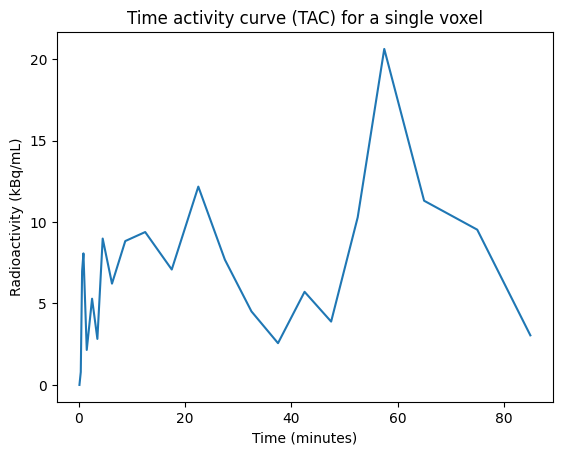
Time activity curve
We can extract the time series data (called the time activity curve, or TAC) for a single voxel:
voxel_index = (100, 100, 100)  # an arbitrarily selected voxel

voxel_tac = pet.dataobj[*voxel_index, ...]
time = pet.frame_mid

plt.figure()
plt.plot(time, voxel_tac)
plt.xlabel("Time (minutes)")
plt.ylabel(f'Radioactivity ({pet.json_dict["Units"]})')
plt.title("Time activity curve (TAC) for a single voxel");

Temporal split
We can split the 4-D PET image (in time).
This operation splits the data matrix and generates PET-BIDS jsons for the split
images, and yields two PETBIDSImage objects.
pet_0to60, pet_60to90 = pet.split(split_time=60) # split_time specified in min
pet_60to90.json_dict
{'Manufacturer': 'Siemens',
 'ManufacturersModelName': 'Biograph mMr',
 'Units': 'kBq/mL',
 'TracerName': 'LondonPride',
 'TracerRadionuclide': 'C11',
 'BodyPart': 'brain',
 'InjectedRadioactivity': 400.0,
 'InjectedRadioactivityUnits': 'MBq',
 'InjectedMass': 5.0,
 'InjectedMassUnits': 'ug',
 'SpecificRadioactivity': 35.0,
 'SpecificRadioactivityUnits': 'GBq/ug',
 'ModeOfAdministration': 'bolus',
 'TimeZero': '09:45:00',
 'ScanStart': 0,
 'InjectionStart': 0,
 'FrameTimesStart': [3600.0, 4200.0, 4800.0],
 'FrameDuration': [600.0, 600.0, 600.0],
 'InjectionEnd': 30,
 'AcquisitionMode': '3D',
 'ImageDecayCorrected': True,
 'ImageDecayCorrectionTime': 0,
 'ReconMethodName': 'MLEM',
 'ReconMethodParameterLabels': ['iterations'],
 'ReconMethodParameterUnits': ['none'],
 'ReconMethodParameterValues': [100],
 'ReconFilterType': 'PSF',
 'ReconFilterSize': 2.5,
 'AttenuationCorrection': 'Activity decay corrected'}
Save 4-D PET image
We save the 60-to-90 min image (along with its PET-BIDS json):
out_fname = pet_fname.with_name(pet_fname.stem + "_60to90min").with_suffix(
    pet_fname.suffix
)
pet.to_filename(out_fname)